Centre for Population analysis of the Regional population publication from the Australian Bureau of Statistics (ABS)
Reference period: -
- Population growth in the capital cities recovered over 2022–23, reaching 3.0 per cent, up from 1.3 per cent growth in the previous year. This was driven by the strong recovery in net overseas migration, with a net inflow of 455,000 overseas migrants to capital cities.
- This net inflow of overseas migrants to capital cities accounted for 86 per cent of national NOM in 2022–23.
- Sydney and Melbourne had the majority of NOM in 2022–23 (for 57 per cent). A further 21 per cent of NOM went to Brisbane and Perth.
- The inner city (SA4s) of these four cities accounted for around 20 per cent of national NOM, despite having just 5.8 per cent of national population.
- The net internal migration outflow from capital cities to regional areas (‑27,000) appears to be recovering from the large net outflows of capital city residents seen during the COVID‑19 lockdowns (‑49,000 in 2020–21).
- Perth (3.6 per cent), Melbourne (3.3 per cent) and Brisbane (3.1 per cent) all grew by over 3 per cent in 2022–23, while Hobart (0.5 per cent) was the only capital city with a growth rate below 1 per cent.
- Combined regional areas grew at 1.4 per cent, the fastest rate of growth since 2008–09.[1] This was driven by primarily by an increase in overseas migration (73,000).
Combined capital cities and regional areas
- In 2022–23, the population of combined capital cities grew by 3.0 per cent (517,000 people), with over 85 per cent of this growth coming from net overseas migration (Chart 1). This was the highest combined capital city growth in the estimated resident population series with the next highest being 2.3 per cent in 2008–09.
- The population of combined regions grew by 1.4 per cent (117,000 people) in 2022–23, less than half the growth of the combined capitals. This is a recent high for regional Australia, but is below levels seen during the mining boom (1.6 per cent in 2007–08 and 2008–09).
- Two‑thirds of combined regional growth was from net overseas migration. Despite the large increase in overseas migration, growth was subdued by internal migration declining from the pandemic highs.
Population growth and its components in capital cities
- Perth’s population grew by 3.6 per cent in 2022–23, the highest growth rate of all capital cities, followed by Melbourne (3.3 per cent), Brisbane (3.1 per cent) and Sydney (2.8 per cent).
- Perth, Melbourne and Sydney all had their highest growth since the beginning of the series in 1971. Brisbane had its highest growth since 1981–82.
- Growth in all four cities was driven by net overseas migration, contributing 157,000 to population in Sydney, 147,000 to Melbourne, 59,000 to Perth and 52,000 to Brisbane (Chart 2). Brisbane has also had a net inflow of internal migrants (15,000 people), continuing a trend for the city.
- Growth in these cities was concentrated in the CBD – driven by higher net overseas migration, with the inner cities (SA4s) of Melbourne, Sydney, Brisbane and Perth accounting for around 20 per cent of national NOM in 2022–23[2]. This may, in part, reflect the return of international students in 2022–23.
- Greenfield suburbs on the fringes of these cities also had high growth. The SA3s of Blacktown – North (Sydney), Melton – Bacchus Marsh (Melbourne), Browns Plains (Brisbane) and Serpentine – Jarrahdale (Perth) all grew by more than 5.5 per cent.
- Population growth was slowest in Hobart (0.5 per cent), Darwin (1.1 per cent), Adelaide (2.0 per cent) and the Australian Capital Territory (2.1 per cent). This lower growth primarily reflects a relatively smaller share of net overseas migration and net internal migration outflows.
- Despite this, Adelaide had its highest growth since the beginning of the series in 1971.
- Hobart experienced its lowest population growth since 2001–02.
- The SA3s of Hobart Inner, Hobart North‑West and the Australia Capital Territory’s Uriarra – Namadgi were the only capital city SA3s to experience population falls in 2022–23[3].
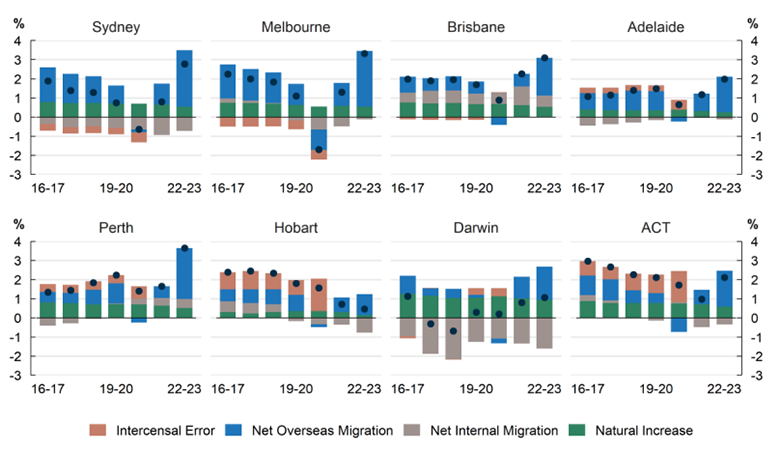
Note: Intercensal error is the difference between the change in population and the sum of the components for a given year.
Population growth and its components in regional areas
- Regional Queensland was the fastest growing rest‑of‑state area in 2022–23 (2.2 per cent), followed by Western Australia (1.4 per cent), Victoria (1.1 per cent) and New South Wales (1.0 per cent).
- Regional Queensland’s growth was driven by a combined inflow of overseas (33,000 people) and internal (17,000 people) migration.
- Over the past decade, population growth in regional Queensland has been driven by the Gold Coast and the Sunshine Coast, with both regions growing at over 2.5 per cent annually since 2001 and accounting for nearly half of regional Queensland’s growth in 2022–23.
- Driving growth in the rest‑of‑state areas of New South Wales, Victoria and Western Australia is NOM. Internal migration to regional Western Australia has recently become a positive inflow after large outflows post‑mining boom.
- Regional Tasmania (0.3 per cent), Northern Territory (0.7 per cent) and South Australia (0.7 per cent) were the slowest growing rest‑of‑state areas.
- Regional Tasmania and South Australia both experienced natural decrease (fewer births than deaths) in 2022–23, reflecting the older age structure of the regions.
- Regional Northern Territory recorded high levels of natural increase and overseas migration but growth was offset by an outflow of internal migrants.
- Regional Tasmania also recorded a net outflow of internal migration of 600 people in 2022–23, well below its peak inflow of 1,600 in 2019‑20.
- The regional cities of the Gold Coast (2.9 per cent), the Sunshine Coast (2.7 per cent) and Geelong (2.2 per cent) were the fastest growing areas in regional Australia in 2022–23. Net overseas migration was the largest contributor to growth for all three cities, with internal migration also making significant contributions to growth for the Sunshine Coast and Geelong.
- Campaspe (SA3) in Victoria had the largest per cent fall in population, declining by 0.7 per cent (260 people, driven by a net internal migration outflow of 330 people). There were three SA3s with negative growth in regional Victoria, and two in each of regional New South Wales, regional South Australia and regional Tasmania. The fall in population in Mid North in South Australia was driven by natural decrease, with net internal migration being the main driver of negative growth in the other SA3s.
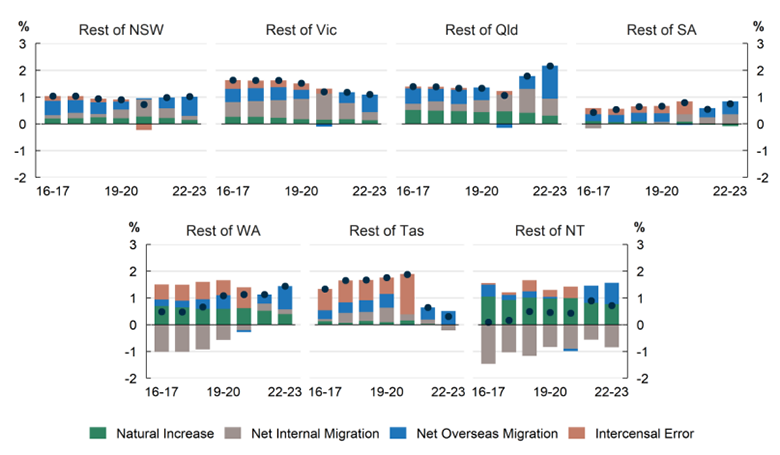
Note: Intercensal error is the difference between the change in population and the sum of the components for a given year.
Population growth by remoteness
- Population growth increased across all remoteness area classifications in 2022–23.
- Major cities (which includes most of the high population density parts of greater capital cities as well as larger cities such as Gold Coast, Newcastle and Geelong) grew at 2.9 per cent.
- Remote and very remote region populations recorded their fastest growth since 2009–10 and 2010–11 respectively, driven by relatively strong population growth in remote parts of Western Australia and Queensland.
- The population of inner regional areas (which is largely made up of areas surrounding capital cities) have experienced similar population growth since at least 2016–17, despite the pandemic and the subsequent recovery.
Data Notes
- Further detail, including data quality notes, are available from the Australian Bureau of Statistics.
- Figures in this publication will not exactly match the data presented in the ABS publication National, State and Territory Population. Sub‑state population data does not incorporate the ABS revisions published on 21 March 2024.
| Reference period | Former catalogue | Release date |
|---|---|---|
| National, state and territory population, December 2023 | 3101.0 | 13/06/2024 |
| Regional Population by Age and Sex, 2023 | 3235.0 | 29/08/2024 |
| National, state and territory population, March 2024 | 3101.0 | 19/09/2024 |
[1] Regional areas include rest‑of‑state areas outside of capital cities, including non‑capital cities such as the Gold Coast and Newcastle, but do not include ‘other territories’ such as Norfolk Island and Christmas Island.
[2] There are 108 Statistical Area Level 4 (SA4s) in Australia. In cities, SA4s tend to have populations of 300,000 to 500,000 people.
[3] There are 359 Statistical Area Level 3 (SA3s) in Australia. In general, SA3s are designed to have populations between 30,000 and 130,000 people.