Centre for Population analysis of the National, state and territory population publication from the Australian Bureau of Statistics (ABS)
Reference period: -
The Estimated Resident Population (ERP) of Australia grew by 0.7 per cent in the March 2023 quarter, to be 2.2 per cent higher than a year earlier.
Australia experienced a record net inflow of 454,000 migrants over the year to March 2023, including 152,000 in the quarter. This was driven by continued strength in arrivals and continued weakness in departures. Net overseas migration (NOM) contributed 0.6 percentage points to quarterly population growth.
Natural increase (births minus deaths) fell to 109,000 over the year to March 2023, a decrease of 18.5 per cent from the previous year. This was driven by an increase in deaths (7.9 per cent) and fall in births (3.4 per cent) over the same period.
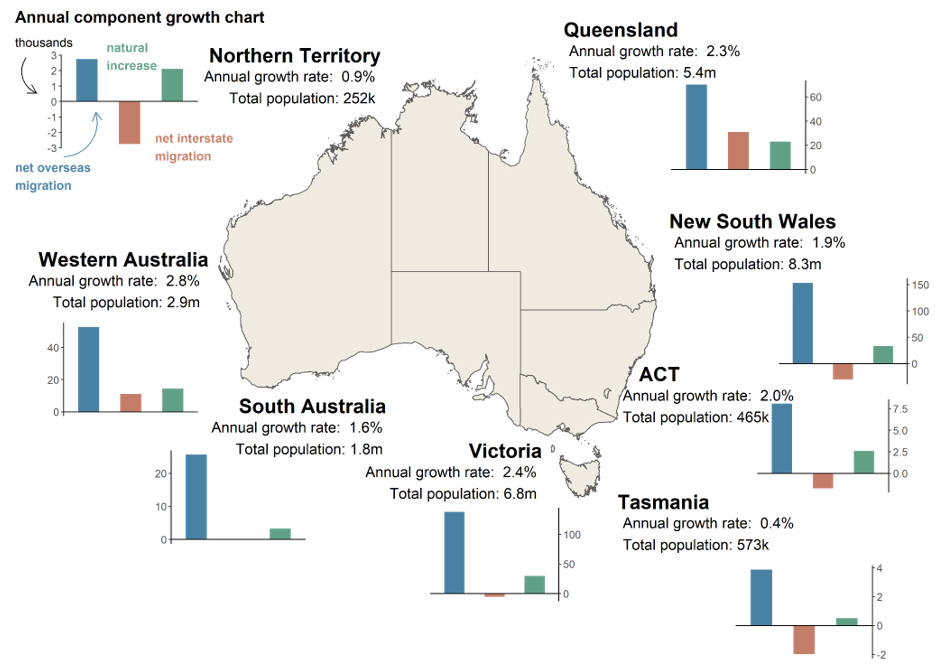
Western Australia had the fastest growing population over the year to March 2023 at 2.8 per cent, followed by Victoria (2.4 per cent) and Queensland (2.3 per cent). Tasmania (0.4 per cent) and Northern Territory (0.9 per cent) were the slowest growing jurisdictions.
The annual number of interstate moves fell relative to a year ago and was 19.3 per cent below the same period in 2019. Net moves to regional areas fell in the March 2023 quarter but are still above levels seen immediately prior to the pandemic.
Strength in temporary migrants continues to drive population growth
- Australia’s population grew by 563,000 people over the year to March 2023, an increase of 2.2 per cent. This is the largest annual persons increase in Australia’s population on record and the highest growth rate since December 2008.
- Population in the March 2023 quarter grew by 182,000 people or 0.7 per cent, driven mostly by strong net overseas migration, while natural increase was still relatively low (Chart 1).
- NOM was 152,000 in the March 2023 quarter and 454,000 over the year to March 2023, which drove most of the annual population growth.
- This was the largest net inflow of overseas migrants on record, reflecting both higher migrant arrivals and subdued departures (Chart 2). Higher NOM has been driven by higher temporary migration, especially higher arrivals of international students, and fewer departures across most temporary visa groups.
- In the quarters covering the 2022 calendar year, NOM was revised up by a total of 22,000.
- Natural increase fell by 25,000 over the year to March 2023 to be 18.5 per cent lower than in 2022.
- There were 192,000 deaths over the year to March 2023, an increase of 7.9 per cent from the previous year. This period covered peaks in deaths due to COVID-19 and other causes (also see Australian Bureau of Statistics (ABS) Provisional Mortality Statistics release).
- There were 301,000 births over the year to March 2023, a decrease of 3.4 per cent.
- The ABS has revised the number of births for the 2021–22 financial year from a registration to an occurrence basis in the March quarter release of National, state and territory population. This provides a clearer picture of how fertility was affected by the COVID-19 pandemic, given birth registrations can be impacted by disruptions to registration behaviour and administrative processing.
- The birth numbers for 2021–22 were revised down by 7,000 in this release.
- Quarterly interstate moves were 95,000 in the March 2023 quarter, down from 110,000 in the December 2022 quarter. This was in line with the usual seasonal fall from December to March. Interstate moves remain significantly below pre‑pandemic levels, with March 2023 quarter moves 20.4 per cent lower than the March 2019 quarter.
- The number of annual interstate moves fell to 379,000 over the year to March 2023 (Chart 3), down from a record high of 509,000 over the year to March 2022. However, it is unlikely all recorded interstate moves actually occurred in the year to March 2022. Interstate moves are estimated using change of address data captured through Medicare, which saw an unprecedented increase due to widespread updating of Medicare records as people received vaccinations for COVID‑19, particularly in the June to December 2021 quarters.
All states and territories experienced population growth in the year to March 2023
- Annual population growth increased in all states and territories except Tasmania, the Northern Territory and South Australia in the year to March 2023 (Chart 4). New South Wales had its fastest annual growth in the series’ history (which begins in June 1981), while Queensland and Western Australia had their fastest annual growth in the last decade.
- Western Australia was the fastest growing jurisdiction in the year to March 2023, driven by high overseas migration. Victoria overtook Queensland to be the second fastest growing jurisdiction in that period, growing faster than Queensland for the first time since December 2019.
- Population growth across all jurisdictions was largely driven by high overseas migrant arrivals and subdued migrant departures over the year to March 2023 (Chart 5).
- Tasmania and the Northern Territory were the slowest growing jurisdictions over the year to March 2023 due to interstate migration outflows and a comparatively smaller share of net overseas migrants.
- Queensland maintained the largest net inflows of internal migrants over the year to March 2023, followed by Western Australia and South Australia. All other states and territories had net outflows.
- There were smaller annual net interstate migration (NIM) outflows for New South Wales and Victoria compared to a year earlier. The remaining states and territories recorded falls in net interstate migration over the same period, with larger falls in interstate arrivals compared to falls in interstate departures.
Note: South Australia’s annual NIM was an inflow of 150 persons.
Net moves to regions have fallen but are still above pre‑pandemic levels
- Net internal migration for regions outside capital cities was 6,000 in the March 2023 quarter, a decrease of 700 from the December quarter and down from a peak of 12,000 in the March 2021 quarter (Chart 6).
- The number of capital city residents moving to regions fell to its lowest value for a March quarter since 2015. This was largely offset by a similar fall in the number of departures from regions to capital cities.
| State | ERP | ERP Increase | ERP Increase | Natural Increase |
NIM | NOM |
|---|---|---|---|---|---|---|
| 31 March 2023 |
Since 31 March 2022 |
annual % | annual contribution |
annual contribution |
annual contribution |
|
| NSW | 8,293,965 | 156,277 | 1.92 | 33,071 | −30,213 | 153,419 |
| VIC | 6,766,559 | 161,691 | 2.45 | 29,690 | −5,644 | 137,645 |
| QLD | 5,418,453 | 124,197 | 2.35 | 22,924 | 31,070 | 70,203 |
| SA | 1,844,616 | 29,174 | 1.61 | 3,360 | 157 | 25,657 |
| WA | 2,855,594 | 78,342 | 2.82 | 14,557 | 11,121 | 52,664 |
| TAS | 572,660 | 2,388 | 0.42 | 501 | −1,994 | 3,881 |
| NT | 251,654 | 2,129 | 0.85 | 2,125 | −2,745 | 2,749 |
| ACT | 464,601 | 8,944 | 1.96 | 2,607 | −1,752 | 8,089 |
| Australia* | 26,473,055 | 563,205 | 2.17 | 108,844 | NA | 454,361 |
* Includes other territories comprising Jervis Bay Territory, Christmas Island, the Cocos (Keeling) Islands and Norfolk Island
| Release | Former catalogue | Release date |
|---|---|---|
| Deaths, Australia, 2022 | 3302.0 | 27/09/2023 |
| Births, Australia, 2022 | 3301.0 | 18/10/2023 |
| National, state and territory population, June 2023 | 3101.0 | 14/12/2023 |
| Overseas migration, 2022–23 | N/A | 15/12/2023 |
Notes
Further detail is available from the ABS in National, state and territory population, March 2023.
Downloads
National, state and territory population, March 2023 PDF 529 kB
National, state and territory population, March 2023 DOCX 338 kB