Centre for Population analysis of the National, state and territory population publication from the Australian Bureau of Statistics (ABS)
Reference period: -
The Estimated Resident Population (ERP) of Australia grew by 0.5 per cent in the December 2022 quarter, to be 1.9 per cent higher than a year earlier.
Australia experienced a record net inflow of 387,000 migrants over the year to December 2022, including 98,000 in the quarter, a record for a December quarter. This was driven by continued strength in arrivals and lower departures. Net overseas migration contributed to 77 per cent of quarterly population growth.
Natural increase (births minus deaths) was 29,000 in the December 2022 quarter, an increase of 7,000 from a record low in the September 2022 quarter, driven by a decrease in deaths.
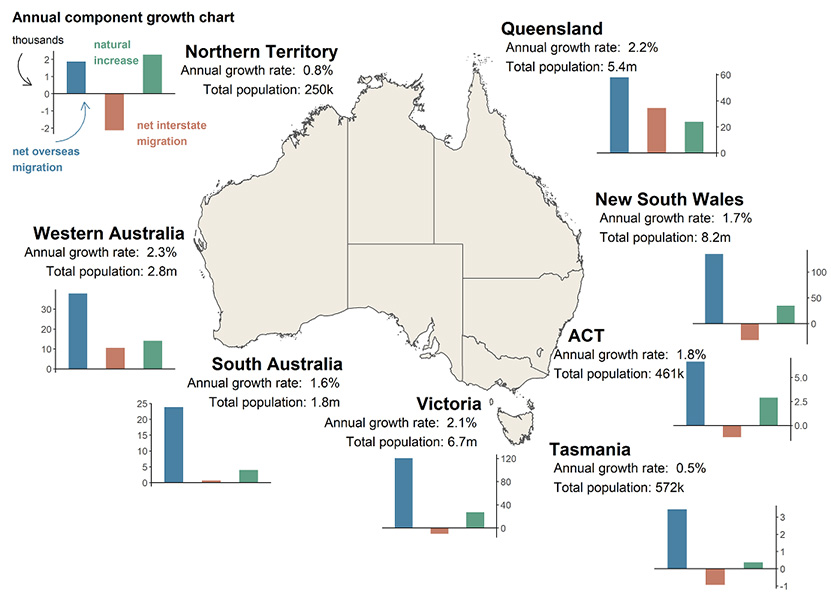
Western Australia had the fastest growing population over the year to December 2022 at 2.3 per cent, followed by Queensland (2.2) and Victoria (2.1). Tasmania (0.5) and the Northern Territory (0.8) were the slowest growing jurisdictions.
Net moves to regional areas were steady in the December 2022 quarter but are still above levels seen immediately prior to the pandemic.
In this release, the ABS finalised rebased population estimates for September 2016 – June 2021 using the 2021 Census of Population and Housing. This release also introduces methodological changes for estimating net interstate migration which results in significant revisions to net interstate migration estimates from September 2016 onwards.
The return of temporary migrants continues to drive population growth
- Australia’s population grew by 497,000 people over the year to December 2022, an increase of 1.9 per cent. This is the largest annual increase in Australia’s population on record, but the growth rate remains well below the peak of 2.2 per cent in 2008.
- Population in the December 2022 quarter grew by 127,000 people or 0.5 per cent, driven mostly by strong net overseas migration (98,000), while natural increase (29,000) was still relatively low (Chart 1).
- Record levels of overseas migration in the quarter were driven both by continued strength in migrant arrivals and subdued departures.
- Overseas migration was 387,000 over the year to December 2022, which drove most of the annual population growth.
- The relaxation of border restrictions beginning in late 2021 has seen a recovery of temporary migrants in Australia, especially students and working holiday makers, resulting in strong net overseas migration. This recovery has been through both a strong recovery in arrivals and continued weakness in departures (Chart 2).
- Natural increase fell to 110,000 over the year to December 2022, 23.4 per cent lower than in 2021.
- There were 191,000 deaths over the year to December 2022, an increase of 11.1 per cent from the previous year. This period covered peaks in COVID‑19 deaths in January and July 2022 (also see analysis of the ABS Provisional Mortality Statistics). There were 301,000 births over the year to December 2022, a decrease of 4.6 per cent from the previous year.
- Quarterly interstate moves were 110,000 in the December 2022 quarter, well up from 76,000 in the September 2022 quarter. Despite the large increase in moves from the previous quarter, interstate moves remain significantly below pre‑pandemic levels, with December 2022 quarter moves 19.8 per cent lower compared to the December 2019 quarter.
- The number of annual interstate moves fell to 388,000 over the year to December 2022 (Chart 3), down from a record high of 509,000 over the year to March 2022. However, it is unlikely all recorded interstate moves actually occurred in these periods. Interstate moves are estimated using change of address data captured through Medicare, which saw an unprecedented increase due to widespread updating of Medicare records as people received vaccinations for COVID‑19, particularly in the June to December 2021 quarters.
- In this release, the ABS has updated their methodology for estimating net interstate migration. However, the updated methodology for estimating interstate moves does not attempt to make adjustments for the spike in moves over this period.
All states and territories experienced population growth in the year to December 2022
- Annual population growth increased in all states and territories except for Tasmania in the year to December 2022 (Chart 4).
- New South Wales and Victoria saw a continued increase in annual population growth, driven by high overseas migration, and both have returned to growth rates last seen in 2017.
- Western Australia overtook Queensland to be the fastest growing jurisdiction in the year to December 2022. The Northern Territory and Tasmania were the slowest growing jurisdictions due to their comparatively smaller share of overseas migration. The Northern Territory was the only jurisdiction where natural increase was the largest contributor to population growth (Chart 5).
- Queensland maintained the largest net inflow of interstate migrants over the year to December 2022, followed by Western Australia and South Australia. Queensland has had the largest annual net inflow of interstate migrants since it surpassed Victoria in the year ending March 2017. All other states and territories had net outflows of interstate migration.
Net moves to regions have fallen but are still above pre‑pandemic levels
- Net internal migration for regions outside capital cities was 6,000 in the December 2022 quarter, similar to the prior 2 quarters, but down from a peak of 12,000 in the March 2021 quarter (Chart 6).
- The number of capital city residents moving to regions rose to be slightly above levels seen prior to the onset of the pandemic, but this was offset by a similar rise in the number of departures from regions to capital cities.
| State | ERP | ERP Increase | ERP Increase | Natural Increase |
NIM | NOM |
|---|---|---|---|---|---|---|
| 31 December 2022 |
Since 31 December 2021 |
annual % | annual contribution |
annual contribution |
annual contribution |
|
| NSW | 8,238,801 | 137,961 | 1.70 | 34,919 | −31,560 | 134,602 |
| VIC | 6,704,281 | 137,721 | 2.10 | 27,216 | −9,955 | 120,460 |
| QLD | 5,378,277 | 116,562 | 2.22 | 23,939 | 34,545 | 58,078 |
| SA | 1,834,275 | 28,526 | 1.58 | 3,999 | 670 | 23,857 |
| WA | 2,825,178 | 62,667 | 2.27 | 14,164 | 10,593 | 37,910 |
| TAS | 571,596 | 2,876 | 0.51 | 369 | −941 | 3,448 |
| NT | 250,149 | 2,022 | 0.81 | 2,277 | −2,124 | 1,869 |
| ACT | 460,855 | 8,336 | 1.84 | 2,893 | −1,228 | 6,671 |
| Australia* | 26,268,359 | 496,756 | 1.93 | 109,785 | NA | 386,971 |
* Includes other territories comprising Jervis Bay Territory, Christmas Island, the Cocos (Keeling) Islands and Norfolk Island
Final rebasing of Australia’s population estimates using the 2021 Census
In this release, the ABS finalised rebased population estimates for September 2016 – June 2021 using the 2021 Census of Population and Housing and more up‑to‑date component data. The preliminary rebased estimates were published in the December 2021 issue of National, state and territory population, released on 28 June 2022. Final rebasing is a process of revising preliminary rebased data to incorporate revisions to Residents Temporarily Overseas, and components of population growth used to backdate from Census night to 30 June 2021.
| State | Preliminary | Final | Difference | |
|---|---|---|---|---|
| ‘000 | ‘000 | ‘000 | % | |
| NSW | 8,093.8 | 8,097.1 | 3.2 | 0.04 |
| VIC | 6,548.0 | 6,547.8 | −0.2 | - |
| QLD | 5,217.7 | 5,215.8 | −1.8 | −0.04 |
| SA | 1,803.2 | 1,802.6 | −0.6 | −0.03 |
| WA | 2,749.9 | 2,749.1 | −0.5 | −0.02 |
| TAS | 567.9 | 567.2 | −0.7 | −0.12 |
| NT | 249.2 | 248.2 | −1.0 | −0.42 |
| ACT | 453.6 | 452.5 | −1.1 | −0.23 |
| Australia | 25,688.1 | 25,685.4 | −2.7 | −0.01 |
In this release, the ABS has incorporated Census 2021 data to update their methodology for estimating net interstate migration. This has resulted in significant revisions to net internal migration estimates from September 2016 onwards, with total interstate moves revised upward by 11.9 per cent between September 2016 and June 2021 and large revisions to cumulative net movements for states and territories (Table 3).
| State | Preliminary | Revised | Difference | |
|---|---|---|---|---|
| ‘000 | ‘000 | ‘000 | % | |
| NSW | −96.6 | −118.8 | −22.2 | 23 |
| VIC | 28.6 | −8.9 | −37.5 | −131 |
| QLD | 121.9 | 128.7 | 6.8 | 6 |
| SA | −17.2 | −10.7 | 6.5 | −38 |
| WA | −28.7 | −9.8 | 18.9 | −66 |
| TAS | 7 | 12.7 | 5.7 | 81 |
| NT | −16.3 | −8.8 | 7.5 | −46 |
| ACT | 1.3 | 15.7 | 14.4 | 1,108 |
| Australia (National interstate movements) |
1,925.9 | 2,154.2 | 228.2 | 12 |
| Release | Former catalogue | Release date |
|---|---|---|
| Regional population, 2021–22 | 3218.0 | 31/08/2023 |
| National, state and territory population, March 2023 | 3101.0 | 14/09/2023 |
| National, state and territory population, June 2023 | 3101.0 | 14/12/2023 |
| Overseas migration, 2022–23 | 3407.0 | 15/12/2023 |
Notes
Further detail regarding the latest population data is available from the ABS in National, state and territory population, December 2022.
Downloads
National, state and territory population, December 2022 DOCX 372 kB
National, state and territory population, December 2022 PDF 506 kB