This page has now been archived Key data releases
Centre for Population analysis of the National, state and territory population publication from the Australian Bureau of Statistics (ABS)
Reference period: -
The Estimated Resident Population (ERP) of Australia grew by 0.5 per cent in the March 2022 quarter, to be 0.9 per cent higher than a year earlier.
There was a strong recovery in overseas migration to a net inflow of 96,000 in the March 2022 quarter, the highest result in the series history (beginning 1981). This saw overseas migration contributing most of quarterly population growth for the first time since the beginning of the pandemic.
Deaths increased to 179,000 over the year to March 2022, 10.0 per cent higher than the year to March 2021 and the largest increase in the series history. This more than offset an increase in births, resulting in natural increase (births minus deaths) to fall to 130,000.
Queensland had the fastest growing population over the year to March 2022, followed by Western Australia and South Australia. Annual population growth in New South Wales and Victoria increased from the previous quarter, while growth in the Northern Territory was slow but positive.
New South Wales and Victoria saw smaller net interstate migration outflows, while Queensland continued to have the largest net inflow of interstate migrants.
This publication was re‑released on 26 September 2022. Estimates for September 2020 to March 2022 have been updated since first release on 21 September 2022.
Overseas migration drove most of the population growth in the March 2022 quarter
- Australia’s population grew by 234,000 people over the year to March 2022, an increase of 0.9 per cent. This was much higher than growth over the year to March 2021 of just 22,000 people (0.1 per cent).
- Population in the March 2022 quarter grew at the fastest rate since the beginning of the COVID‑19 pandemic, by 124,000 people or 0.5 per cent, driven mostly by the strong recovery in net overseas migration.
- The March 2022 quarter was the first full quarter of data to incorporate the easing of international travel restrictions in December 2021. As a result, a strong recovery in overseas arrivals saw the quarterly net inflow of migrants (96,000) increase to the highest level in the history of this series (see Chart 1).
- Overseas migration recovered to 110,000 in the year to March 2022, the largest annual inflow of overseas migrants since travel restrictions were introduced in March 2020 (see Chart 2).
- This was the result of the March 2022 quarter experiencing a combination of the highest level of arrivals (150,000) compared to all other quarters since the start of the pandemic and a continued low level of departures (54,000).
- Natural increase continued to drive most of the population growth over the year to March 2022, with births outnumbering deaths by 130,000.
- There were 309,000 births over the year to March 2022, an increase of 3.4 per cent from the previous year and the highest annual births figure since 2017. Deaths in the year to March 2022 experienced the fastest annual increase in the series history of 10.0 per cent, a period covering peaks in COVID-19 infections. This resulted in natural increase falling by 4.6 per cent over the year (also see analysis of the ABS Provisional Mortality Statistics).
- The Australian Bureau of Statistics revises the most recent financial year of births from a registration basis to an occurrence basis in the March quarter release of National, state and territory population. This provides a clearer picture of how fertility was affected by the COVID-19 pandemic, given birth registrations can be impacted by disruptions to registration behaviour and administrative processing.
- The March 2022 population statistics included upwards revisions to birth numbers for 2020–21 by 7,000. This included the highest quarterly births recorded in the series history in March 2021 of 80,000, a 12.6 per cent increase from the previous quarter.
- There were 309,000 births over the year to March 2022, an increase of 3.4 per cent from the previous year and the highest annual births figure since 2017. Deaths in the year to March 2022 experienced the fastest annual increase in the series history of 10.0 per cent, a period covering peaks in COVID-19 infections. This resulted in natural increase falling by 4.6 per cent over the year (also see analysis of the ABS Provisional Mortality Statistics).
- The number of interstate moves rose to a record high of 485,000 over the year to March 2022 (see Chart 3), up from 484,000 over the year to December 2021.
- It is unlikely all these interstate moves were made in the year to March 2022. Interstate moves are estimated using change of address data captured through Medicare, which have seen an unprecedented increase because of the COVID-19 vaccination program.
All states and territories experienced population growth in the year to March 2022
- Annual population growth increased in all states and territories for the first time since the start of the pandemic due to a strong recovery in overseas migration (see Chart 4).
- Queensland and Western Australia continued to be the fastest growing jurisdictions in the year to March 2022. Northern Territory was the slowest growing jurisdictions due to the comparatively smaller share of net overseas migrants it receives (see Chart 5).
- Queensland maintained the largest net inflow of internal migrants over the year to March 2022, followed by Western Australia and South Australia. All other states and territories had net outflows.
- In the March 2022 quarter, lower interstate departures saw smaller net outflows of residents from New South Wales and Victoria to other jurisdictions. As a result, Queensland saw a decline in interstate arrivals.
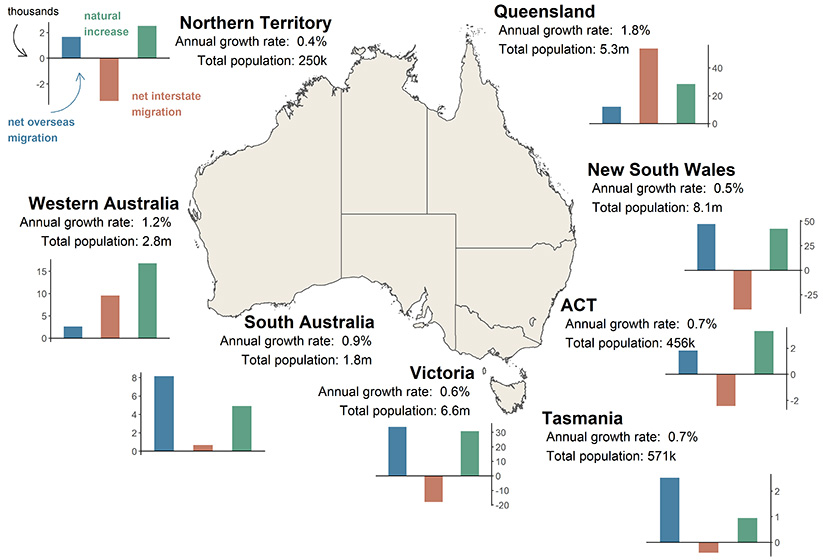
Note: Components of growth will not match the total growth due to the intercensal difference, notably for the Northern Territory. For further information on the intercensal difference please see Rebasing of Australia’s population estimates using the 2021 Census, at population.gov.au.
| State | ERP | ERP Increase | ERP Increase | Natural Increase | NIM | NOM |
|---|---|---|---|---|---|---|
| 31 March 2022 |
Since 31 March 2021 |
annual % | annual contribution |
annual contribution |
annual contribution |
|
| NSW | 8,130,115 | 44,447 | 0.55 | 42,502 | −40,057 | 47,095 |
| VIC | 6,593,314 | 41,543 | 0.63 | 30,789 | −17,997 | 33,691 |
| QLD | 5,296,098 | 92,075 | 1.77 | 28,333 | 53,984 | 11,981 |
| SA | 1,815,485 | 15,422 | 0.86 | 4,915 | 673 | 8,167 |
| WA | 2,773,435 | 32,184 | 1.17 | 16,837 | 9,571 | 2,634 |
| TAS | 571,165 | 4,079 | 0.72 | 950 | −413 | 2,518 |
| NT | 250,398 | 958 | 0.38 | 2,520 | −3,330 | 1,669 |
| ACT | 455,869 | 3,381 | 0.75 | 3,329 | −2,431 | 1,817 |
| Australia* | 25,890,773 | 234,143 | 0.91 | 130,186 | NA | 109,608 |
* Includes other territories comprising Jervis Bay Territory, Christmas Island, the Cocos (Keeling) Islands and Norfolk Island
| Release | Former catalogue | Release date |
|---|---|---|
| Deaths, Australia, 2021 | 3302.0 | 29/09/2022 |
| Births, Australia, 2021 | 3301.0 | 25/10/2022 |
| National, state and territory population, June 2022 | 3101.0 | 15/12/2022 |
| Overseas Migration | N/A | 16/12/2022 |
Notes
Further detail regarding the latest population data is available from the ABS in National, state and territory population, March 2022.
Downloads
National, state and territory population, March 2022 DOCX 302 kB
National, state and territory population, March 2022 PDF 468 kB