This page has now been archived Key data releases
Regional Population, 2020–21
Reference period: -
- This release of substate population data reveals the uneven distribution of COVID‑19 on Australia’s population.
- In the 12 months to June 2021, the combined capital cities population declined for the first time on record – falling to −0.1 per cent from an average of 1.8 per cent over the decade prior to the pandemic.
- Overall, this was driven by a large net outflow of 85,000 overseas migrants from capital cities as well as increased internal migration from capital cities to regional areas. Natural increase (births less deaths) was largely unchanged from the previous year.
- Melbourne had the largest population decline, with a loss of 61,000 people (−1.2 per cent), driven by large net outflows of both overseas migrants and internal migrants.
- Regional areas grew at a similar rate to the previous year. This was driven by record levels of internal migration, with regional areas gaining 49,000 people from capital cities in 2020–21, up from 30,000 in 2019–20.1
- Some of the fastest growing areas of Australia were populated areas near major cities, with strong growth in Geelong, the Hunter Valley and the Sunshine Coast, mostly driven by internal migration gains.
- Internal migration figures may be influenced by data quality issues, see Data Notes section for details.
Combined capital cities and regional areas
- In 2020–21, combined capital cities experienced negative population growth for the first time on record (Chart 1). While all capital cities experienced a decline in growth, the largest fall was in Melbourne, where the population declined by 61,000 people – roughly equivalent to a town the size of Wagga Wagga.
- Regional areas grew at a faster rate than capital cities for the first time since 1993–94. Regions grew at 0.9 per cent, only a small decline from 2019–20 (1.0 per cent). Regional New South Wales was the only jurisdiction to increase its growth rate in 2020–21 (from 0.8 to 1.0 per cent), recording its highest growth rate since 2009–10.
Population growth by state
- Population growth fell in each of the states and territories, driven by slowing growth in capital cities (Chart 2). The smallest fall was in the Northern Territory, where growth was already low prior to the pandemic.
- In every state and territory, except Western Australia, growth in regional areas overtook capital city growth. This was particularly noticeable in regional areas of New South Wales and Victoria, where increases in internal migration offset falls in overseas migration.
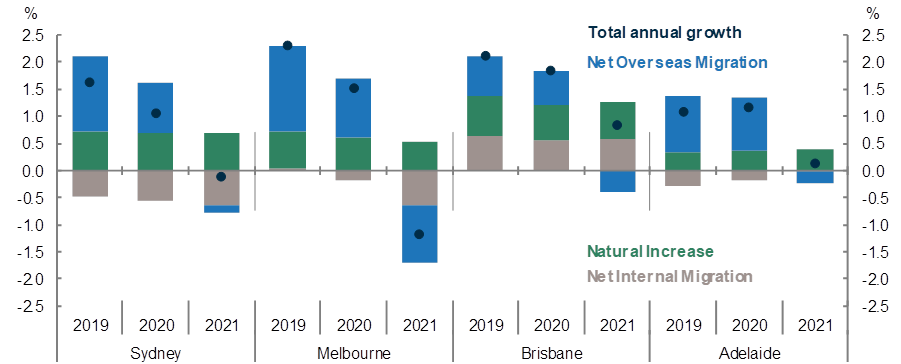
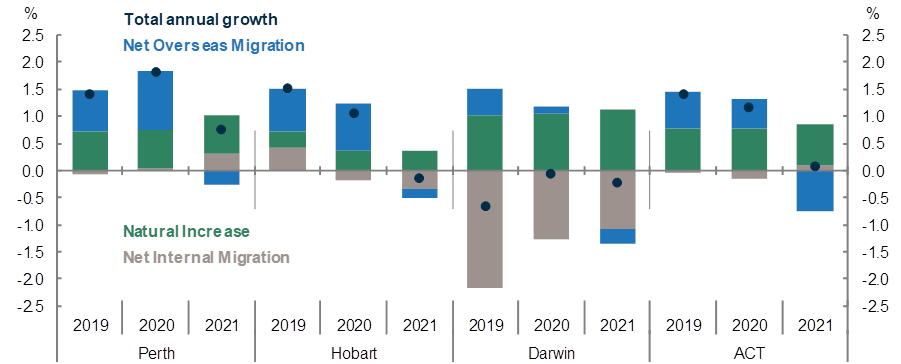
Population growth and it’s components in capital cities
- While all capital cities experienced a decline in population growth in 2020–21, Sydney, Melbourne, Hobart and Darwin also experienced negative population growth.
- Sydney (−0.1 per cent) and Melbourne (−1.2 per cent) recorded the first year of negative population growth since 1952–53 and the Great Depression respectively. This was driven by outflows of overseas migrants and internal migrants in both cities (Chart 3). Melbourne had, by far, the largest outflow of overseas migrants of any capital city in 2020–21, with net outflows of 54,000 migrants.
- Prior to the pandemic Melbourne had experienced net internal migration just above zero (meaning inflows of new residents roughly offset outflows of those moving away). However, the extended lockdowns during 2020–21 saw large reductions in internal migration to Melbourne and also more people leaving the city.
- Outflows of overseas and internal migrants meant that Hobart also recorded negative population growth for the first time since 1997–98.
- Darwin continued its trend of negative population growth seen in recent years, largely driven by net outflows of internal migrants.
- Sydney (−0.1 per cent) and Melbourne (−1.2 per cent) recorded the first year of negative population growth since 1952–53 and the Great Depression respectively. This was driven by outflows of overseas migrants and internal migrants in both cities (Chart 3). Melbourne had, by far, the largest outflow of overseas migrants of any capital city in 2020–21, with net outflows of 54,000 migrants.
- Population growth slowed in Brisbane, Adelaide, Perth and the Australian Capital Territory in 2020–21, however growth in these cities remained positive.
- While these capital cities had net outflows of overseas migrants, this was offset by higher net internal migration compared to 2019–20. The Melbourne lockdowns meant that fewer people left these jurisdictions to go to Melbourne compared to previous years.
- Brisbane continued to be Australia’s fastest growing capital. Brisbane has historically been a large net gainer of internal migrants, and this continued in 2020–21 with a net gain of 15,000 internal migrants.
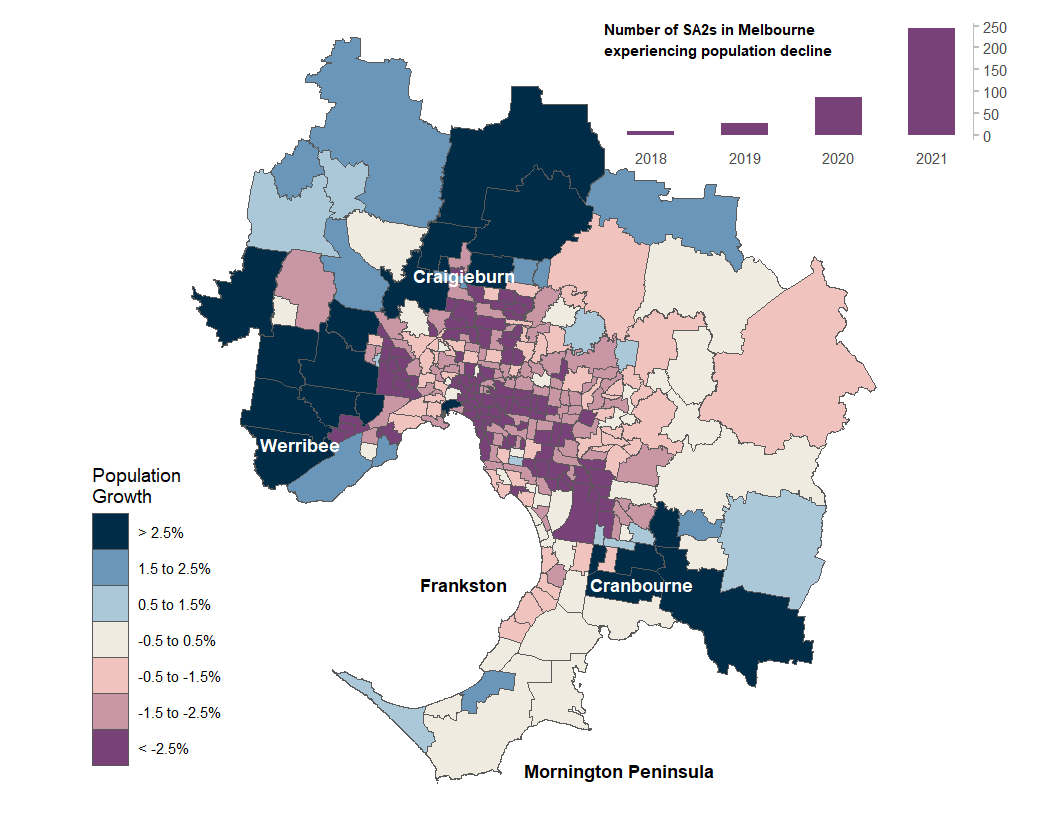
Box 1: How population decline affected Melbourne in 2020–21
- The number of SA2s2 experiencing population decline has increased in Melbourne, up from 27 in 2018–19 to 244 in 2020–21 (Chart 4).
- Similar to trends in other capital cities, slowing population growth has had the greatest impact on Central Business Districts (CBDs) and inner‑city suburbs, as these areas have historically relied on overseas migrants for a large proportion of their growth. Melbourne’s CBD and inner areas had the largest population decline in the country, with the SA43 of Inner Melbourne declining by 4.2 per cent in 2020–21. The one area of the CBD that avoided population decline was the Melbourne Docklands Precinct (shown by the single dark blue area west of the CBD in Chart 4).
- Almost all of the middle‑ring suburbs of Melbourne recorded population declines in 2020–21, although the rate of population decline was less than CBD and inner areas. Population declines were particularly noticeable in suburbs to the east and south‑east along the Eastern and Monash Freeways.
- Falls in population growth in these areas were led by falls in overseas migration, as well as large outflows of internal migration.
- In comparison, greenfield development in the outer areas of cities have had higher rates of population growth as they have maintained higher rates of inbound internal migration. Areas around Cranbourne, Werribee and Craigieburn recorded strong population growth of over 2.5 per cent in 2020–21.
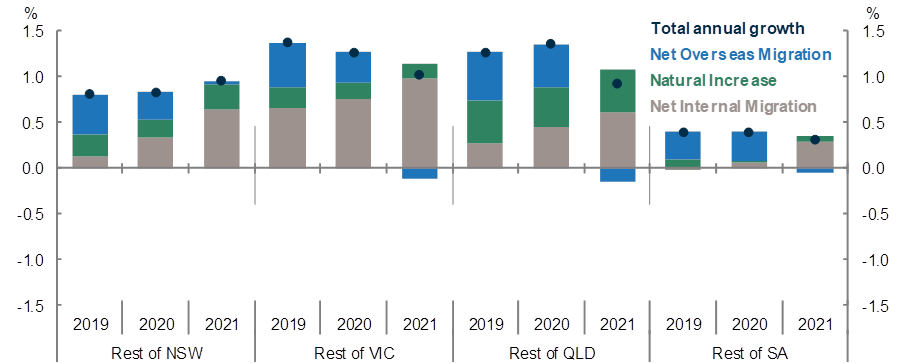
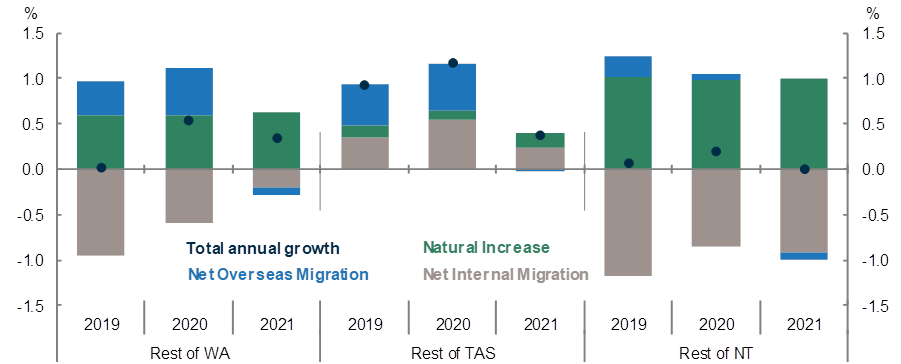
Population growth and its components in regional areas
- Population growth was less affected in regional areas, as falls in overseas migration were offset by gains in internal migration (Chart 5).
- Growth in regional South Australia, Western Australia and the Northern Territory were largely unchanged from the previous year.
- Population growth increased in regional New South Wales, driven by a doubling of net internal migration compared to the previous year. Regional New South Wales was also the only location to experience positive net overseas migration in 2020–21, likely driven by returning Australians.
- Regional Victoria overtook regional Queensland as the fastest growing regional area, as high levels of overseas migration seen previously to regional Queensland declined.
- However, regional Queensland continued its historical pattern of strong population growth (which is generally driven by areas such as the Gold Coast and Sunshine Coast).
- Regional Tasmania also experienced a noticeable decline in growth in 2020–21, driven by an outflow of overseas migrants as well as a decrease in net internal migration as more people left regional Tasmania compared to 2019–20.
- Three of the fastest growing small areas (SA4s) in Australia were in regional areas close to the east coast capital cities. Geelong in Victoria was the second fastest growing SA4, growing at 2.1 per cent in 2020–21, behind only Ipswich in Queensland. The Hunter Valley in New South Wales (2.1 per cent) and the Sunshine Coast in Queensland (1.9 per cent) followed in third and fourth place.
Data notes
- Further detail, including data quality notes, are available from the Australian Bureau of Statistics.
- The high internal migration figures should be interpreted with some caution as ABS data show a high number of interstate moves in the June quarter of 2020–21 which are unlikely to accurately reflect the occurrence of internal movements. This was driven by increased numbers of people updating their Medicare address during the mass vaccination program.
- Figures in this publication will not exactly match the data presented in the ABS publication National, State and Territory Population. Sub‑state population data does not incorporate the ABS revisions published on 19 March 2022.
1 Regional areas include all areas outside of capital cities, including non‑capital cities such as the Gold Coast and Newcastle.
2 Statistical Areas Level 2 (SA2s) are the second smallest geographic areas that the ABS use and represent a community that interacts together socially and economically. There are 2,292 SA2s in Australia, with an average population of 11,000 people.
3 Statistical Areas Level 4 (SA4s) are the largest substate geographical areas that the ABS use and represent labour force regions.