Centre for Population analysis of Regional population data from the Australian Bureau of Statistics (ABS)
Reference period: -
- This release of substate population data shows that growth in the capital cities recovered over 2021–22, driven by the return of net overseas migration, but still remained below pre‑pandemic levels.
- In 2021–22, the combined capital cities population increased by 1.2 per cent, after falling by 0.3 per cent in the previous year.
- Overall, this was driven by the strong recovery in net overseas migration, with a net inflow of 151,000 overseas migrants to capital cities. Natural increase (births less deaths) declined from the previous year as the increase in births was more than offset by the increase in deaths due to COVID‑19. Net internal migration to capital cities was largely unchanged from the previous year.
- Brisbane had the largest population increase of 59,000 people (2.3 per cent), driven by net inflows of internal migrants.
- Population growth in Melbourne (1.1 per cent) and Sydney (0.7 per cent) also rebounded strongly, but still remained below pre‑pandemic levels.
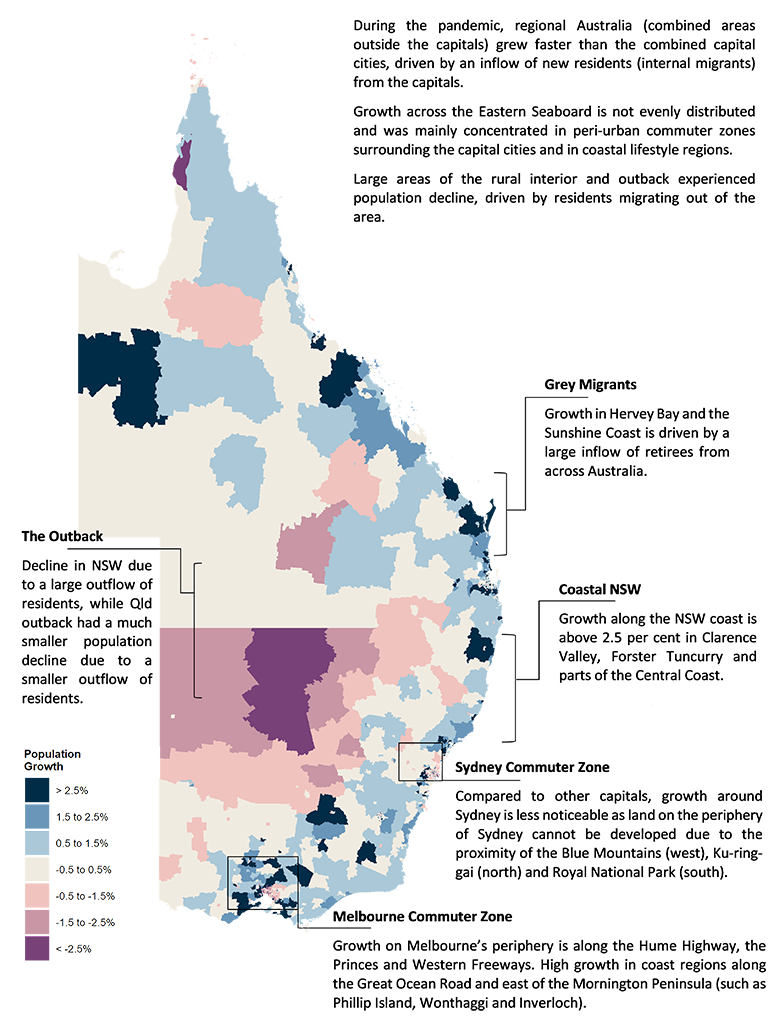
- Regional areas grew at 1.2 per cent, which is a similar rate to growth seen over the last few years.[1] This was driven by continued high levels of internal migration, although internal migration figures should be interpreted with caution as they may be influenced by data quality issues, see Data Notes section for details. The return of net overseas migration also contributed to growth in regional areas.
- Some of the fastest growing regional areas of Australia are around the major capitals and in coastal lifestyle areas – particularly in Victoria near Phillip Island and along the Surf Coast and in Queensland along the Sunshine Coast and in Hervey Bay (Figure 1).
Combined capital cities and regional areas
- In 2021–22, combined capital cities bounced back from the negative population growth recorded in 2020–21 (Chart 1). While growth in all capital cities recovered, driven by the recovery in net overseas migration over the year, growth remained below rates experienced prior to COVID‑19. In 2021–22, Brisbane had the fastest growing population with an increase of 59,000 people.
- Combined regions grew by 1.2 per cent, a moderate increase from 2020–21 (1.0 per cent). The population of regional areas increased by over 100,000 people in 2021–22, the largest increase since 2009. Of all regional areas, Regional Queensland had the fastest growth rate in 2021–22, at 1.9 per cent.
Population growth by state
- After falling to record lows in 2020–21, annual population growth rose in each of the states and territories (except for Tasmania) in the year to June 2022 (Chart 2). For most states this was driven by the recovery in overseas migration in 2021–22 following the loss in population a year earlier due to the closure of international borders.
- Queensland was the fastest growing jurisdiction, followed by Western Australia and Victoria.
- New South Wales saw an increase in annual population growth while Victoria recovered from negative growth seen in 2020–21. However, growth in these states remains below rates experienced prior to the pandemic.
- Growth in capital cities overtook growth in regional areas, except New South Wales and the Northern Territory. This turnaround from 2020–21 is largely due to the return in overseas migrants in 2021–22, while New South Wales and the Northern Territory had fewer people leaving regional areas than people moving back to capitals.
Population growth and its components in capital cities
- In 2021–22, Brisbane’s population grew by 2.3 per cent, recording the highest growth rate of all capital cities, followed by Perth (1.5 per cent), Adelaide (1.1 per cent) and Melbourne (1.1 per cent).
- Brisbane has historically been a large net gainer of internal migrants, and this continued in 2021–22 with a net gain of 28,000 internal migrants. (Chart 3). Brisbane also recorded its highest growth rate since 2009.
- Perth’s population increased by 1.5 per cent, with the biggest driver being natural increase and inflows from both internal and overseas migration. While Brisbane was the fastest growing capital city in 2021–22, Perth was the fastest growing capital city over the previous three years.
- Adelaide and Melbourne both grew by 1.1 per cent, driven by net overseas migration. Melbourne had the largest increase in growth of any capital city, after falling 1.6 per cent in 2020–21 due to the impact of lockdowns, but its growth was still below pre‑pandemic levels.
- Population growth was slowest in Darwin, Hobart, the Australian Capital Territory and Sydney.
- Low growth in Darwin (0.5 per cent), the Australian Capital Territory (0.7 per cent), and Sydney (0.7 per cent) was driven by net outflows of internal migration.
- While Darwin was the slowest growing capital city, it experienced its highest population growth since 2016–17, with strength in natural increase and overseas migration offsetting the outflow of internal migrants.
- Growth in Sydney and the Australian Capital Territory remain well below their pre‑pandemic averages.
- Hobart grew by 0.7 per cent, with the relatively low growth driven by a net outflow of internal migration and a low natural increase contribution relative to other cities. Tasmania has an older age structure and lower total fertility rates compared to the national average.
- While population growth increased in all capital cities in 2021–22, the recovery in growth was particularly strong in the centres of Sydney and Melbourne driven by the return of overseas migrants (mainly international students) to areas around the major universities.
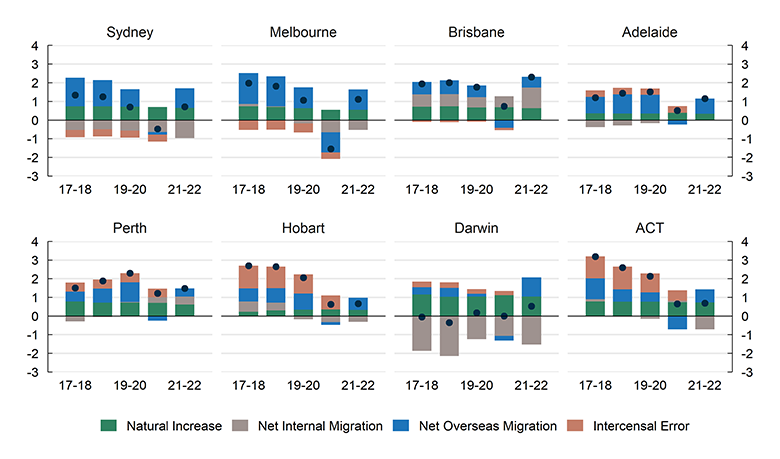
Note: Intercensal error is the difference between the change in population and the sum of the components for a given year. The ABS has significantly revised growth for Hobart and the Australian Capital Territory, but has not attributed these increases to the components of growth. The ABS will release the final rebased regional population figures in August 2023.
(a) Statistical Areas Level 2 (SA2s) are the second smallest geographic areas that the ABS use and represent a community that interacts together socially and economically. There are 2,454 SA2s in Australia, with an average population of 11,000 people.
(b) In this figure, SA2s with a population less than 500 in 2021–22 have had growth set to zero.
Population growth and its components in regional areas
- Growth in regional Australia has remained steady during the pandemic, with growth driven by net interstate migration which accounted for almost half of the increase in 2021–22 (Chart 4).
- Growth in regional areas increased compared to 2020–21 (1.0 per cent), with the growth in 2021–22 entirely attributable to the recovery of net overseas migration, which was a small net outflow in 2020–21 (−5,000) and was over 32,000 people in 2021–22.
- Regional Queensland was the fastest growing regional area in 2021–22 (1.9 per cent), driven by a combined inflow of internal and overseas migration, which contributed 38,000 people to the population in 2021–22.
- Over the past decade, population growth in regional Queensland has been driven by the Gold Coast and the Sunshine Coast, with both regions growing at over 2 per cent annually since 2012.
- Regional South Australia and regional Tasmania were the two slowest growing regional areas.
- Regional South Australia has very low natural increase (births minus deaths) due to the older age structure of the region.
- Regional Tasmania recorded a net inflow of internal residents of 600 people in 2021–22, well below its average annual inflow of 1,100 over the past four years.
- The regional cities of Geelong and the Sunshine Coast were the fastest growing areas in regional Australia over the last three years, both growing annually at 2.3 per cent over the period.
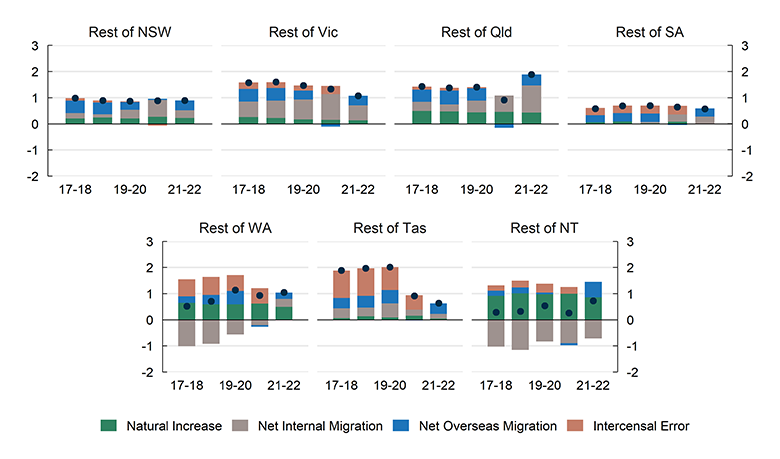
Note: Intercensal error is the difference between the change in population and the sum of the components for a given year. The ABS will revise the estimated resident population and components in June 2023.
Data Notes
- Further detail, including data quality notes, are available from the Australian Bureau of Statistics.
- The internal migration figures should be interpreted with some caution as ABS data show a high number of moves in the June to December quarters of 2021, which are unlikely to accurately reflect the occurrence of internal movements in a specific period. This was driven by increased numbers of people updating their Medicare address during the mass vaccination program.
- Figures in this publication will not exactly match the data presented in the ABS publication National, State and Territory Population. Sub‑state population data does not incorporate the ABS revisions published on 16 March 2023.
| Reference period | Former catalogue | Release date |
|---|---|---|
| National, state and territory population, December 2022 | 3101.0 | 15/06/2023 |
| National, state and territory population, March 2023 | 3101.0 | 14/09/2023 |
| Regional Population by Age and Sex, 2022 | 3235.0 | 28/09/2023 |
[1] Regional areas include all areas outside of capital cities, including non‑capital cities such as the Gold Coast and Newcastle.