Over the last 35 years interstate migration has fallen by a third and natural increase has halved as a share of the total population.
Source. Centre for Population analysis of ABS National, State and Territory population data
Text description
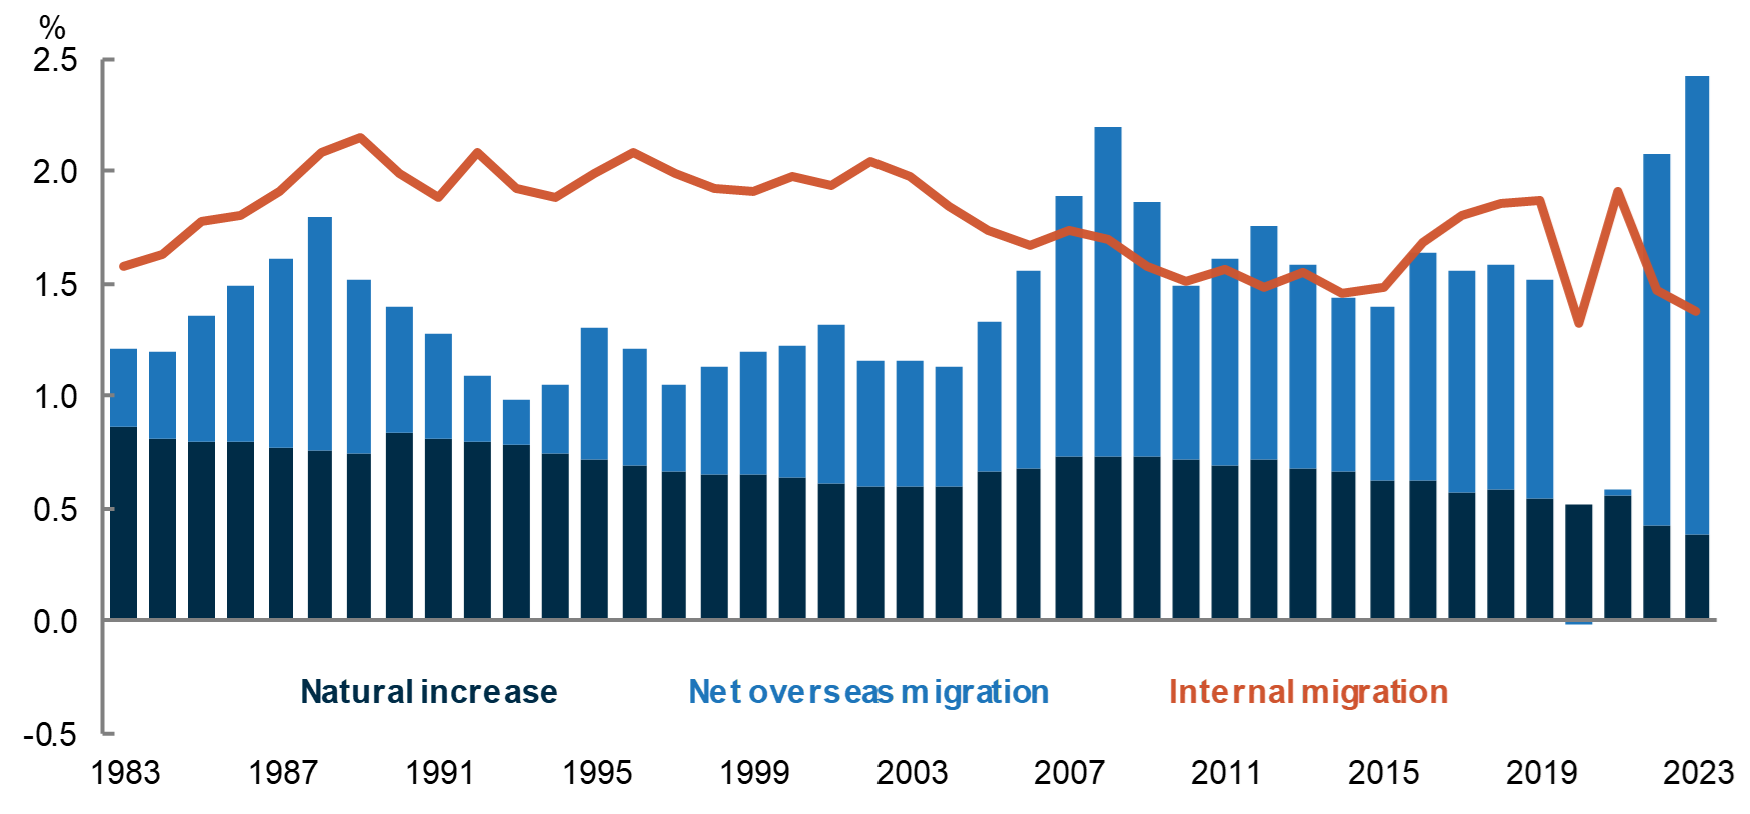
Text description of Chart 1: Australia’s natural increase and net overseas migration to interstate migration as a share of the total population
A chart that compares Net Overseas Migration, Natural Increase and Interstate Migration as a percentage of the population for Australia between 1982 and 2022.
The main trends are:
Natural increase has gradually declined since 1982 going from 0.81 per cent to 0.42 per cent in 2022. This is except for the baby bump period between 2005 and 2009 where natural increase went from 0.59 per cent in 2004 to a peak of 0.73 per cent from 2007 to 2009.
Net overseas migration fluctuated during the 1980’s going from its lowest point of 0.36 per cent in 1983 to 1.04 per cent in 1988.
Net overseas migration was relatively low in the 1990’s and early 2000’s. Net overseas migration increased rapidly in 2005 and peaked in 2008. Net overseas migration stabilised in 2011 at a level that was much higher than between 1982 and 2005. Net overseas migration remained at this level until the COVID lock downs in 2020, where Net overseas migration was negative. In 2022 Net overseas migration increased to its highest level since 2008.
Interstate migration increased with net overseas migration in the 1980’s until 1991. From 1992 until 2002, interstate migration was stable at around 2 per cent. From 2003 onwards interstate migration starts to decline until 2015.
Between 2016 and 2019, interstate migration increases due to a change in the way interstate migration was measured. In 2020 interstate migration decreases due to the COVID lockdowns, but in 2021 interstate migration increased. In 2022 interstate migration fell again.
NOM has been a bigger contribution to population growth than natural increase
Since 2005, net overseas migration (NOM) has consistently been the largest contributor to Australia’s population growth due to increased levels of temporary migration.[1] NOM as a share of population peaked in 2008 and stabilised by 2011. This pattern persisted until the COVID‑19 pandemic during which border closures disrupted migration. As Australia’s international borders reopened in 2022, NOM as a share of population has risen to above pre‑pandemic levels. This increase has been primarily attributed to pent up demand for international study and a strong domestic labour market.[2]
Meanwhile, natural increase (NI) (defined as births minus deaths) has been steadily trending downwards as a percentage of the population since the 1990s, after remaining largely stable in the 1980s. Factors that contribute to the observed fertility decline include changing costs of having children, increased labour force participation and higher education amongst women, and changing social norms.[3] In the 2000s, this trend temporarily reversed due to Australia’s increased fertility rate. This fertility bump was also seen across developed English‑speaking countries.[4] This temporary fertility rate reversal ceased in 2009 and has since continued to decline to its lowest levels.
Interstate mobility has declined over the long term
From the late 1980s until 2004, interstate migration (IM) as a percentage of population tended to fluctuate at around 2 per cent of the population. From 2005 until 2015, IM as a percentage of population has seen a steady decline as a percentage of total population. The broad downwards trend in IM can be attributed to several factors, including an increasingly older population less likely to relocate, a higher share of dual income households that find it more difficult to leave established careers and networks, the increase in working from home, and adults moving out of their parents’ home later in life.[5]
The measurement of IM was impacted by increased Medicare address changes during the pandemic, with the ABS noting that moves recorded in the second half of 2021 were implausibly high. Following the 2021 Census, the ABS revised total moves for 2016–2021. This is partially responsible for the increase in this period, particularly for the increase in 2021.[6] In the post COVID‑19 years, IM as a percentage returned to a trend that was similar to the 2010s.
Footnotes
[1] ABS, Overseas Migration, 2023
[2] Centre for Population, 2023 Population Statement, 2023
[3] Gray et al, Impacts on policies on fertility rates, 2022
[4] Gray et al, Impacts on policies on fertility rates, 2022
[5] Centre for International Economics, Internal Migration in Australia and the impact of government levers, 2023
[6] ABS, National, state and territory population methodology, 2023